Doing mathematics surrounded by a fantastic setting – that promises the current Task of the Week to the statue of Diogenes of Sinope. Known as an influential Greek philosopher, he is said to have no permanent home and, instead, often spent the night in a barrel. This barrel is the core of our mathematical calculations.


Task: Diogenes and his barrel (task number: 4467)

Determine the volume of the barrel in which Diogenes lives. Give the result in liters.


How can the barrel best be described by known geometric bodies? Certainly different models are possible. A sufficiently accurate model is the use of two truncated cones, with each of the bases with the larger radius in the middle of the barrel abut each other.

The height is easily determined by measuring the height of the barrel divided by 2. By means of the circumference in the middle of the barrel and at the bottom / top each, the small and large radius can be determined. Hereby, the regular patterns on the barrel can help.

Using the formula for a truncated cone then results in the approximate volume for the entire barrel.

The city center of Münster provides several different tasks as one can notice within the portal map. Also in the trail around the Aasee, Münster presents itself from a various mathematical side.


Aufgabe: Vertebra (Task Number: 4096).

The work of art by Henry Moore created in 1974 represents several idealized vertebrae. These vertebrae are deliberately close, yet unconnected to each other. Imagine, they were being put together and seen as part of an adult’s human spine. In reality, an average vertebra of a 1.80 m adult is about 2 cm long. Guess how big a giant would be whose spine would consist of vertebrae of this size (in m).


In this task, especially estimation and modelling are forced. Through the detail on the relation of body size and size of a human vertebra in the task, the size of the vertebra can be determined as an object of reference. An adequate measurement and calculation by means of the realtion results the questioned size.

At the beginning of the month, Iwan Gurjanow presented the MathCityMap project in Sweden at the PME conference. Of course, around the location, different tasks were created as our current Task of the Week.


Task: Height of the Statue (Task Number: 4303)

How high is this statue? Give the result in meters.


The task can be solved via different approaches. On the one hand, it is possible to estimate how often a person with a known height fits into the heigth of the statue.

A more elaborated approach is the application of the intercept theorem, which is shown in the hint picutre. One can use the folding ruler as object of reference.


This week, Carmen Monzo, teacher in Spain gives us an inside into her task “Colums in the Parc”. It is created in a parc in Albacete, which ” is full of mathematical elements,  though people are not aware of them until they are in math-vision mode.”


Task: Columns in the Parc (Task Number: 3981)

Calculate the lateral surface (in m²) of one of the columns of this structure.


“I especially love this structure.  Parallel and perpendicular lines can be easily identified, as well as a set of columns (cylinders) whose lateral surface can be easily calculated by using a folding ruler or a measuring tape, and a calculator to introduce the data and the formula. The height of the cylinder is easy to get, but to calculate the radius of the base as accurate as posible, students first have to measure the circumference and then divide by 2*pi.

As this structure has a dozen columns, the activity can be done by around 20 students, comparing their results and thinking about the importance of the accuracy when measuring. To solve this task, students should have previously studied 2D and 3D shapes, the concept of the lateral surface and some formula to calculate it.

As a secondary mathematics teacher, I think that our students need to handle things, measure, count, touch, feel, use their senses… MathCityMap provides the motivation students and teachers need to do those things with the help of the mobilephone technology.”

The classical geometric bodies and figures can be found numerously in the environment. However, real objects deviate from the ideal body and require modeling skills. In addition, composite bodies are not uncommon as in our current “Task of the Week”, which was created by Bente Sokoll, a student at the Johannes-Brahms-Gymnasium in Hamburg.


Task: Volume under the roof (Task number: 4194)

Calculate the volume under the roof (if the sides were closed). Give the result in m³.


To calculate the volume, the body is split into a cuboid and two semi (idealized) cylinders. For the cuboid, length, width and height must be measured and multiplied. For the cylinder, one needs the diameter (or the radius) and the height of the cylinder, which corresponds to the width of the cuboid. The necessary formulas give the sum of the individual volumes.

The task is also a nice example of how MathCityMap students can become authors themselves. In this case, students were asked to create assignments for younger grades. We are looking forward to the usage of the tasks!

On June, 15th and 16th, the MoMaTrE partners from Frankfurt und Spain met in Alcala de Henares near Madrid  in order to fix aims and tasks for the project.

In this context, we created ceveral tasks enjoying the sunny Spanish weather. The Spanish architecture as well as the historical importance of the city allowed various questions. The Task of the Week focuses on the age of the author of Don Quijote, Miguel de Cervantes. The group photo was taken in front of his birthplace.


Task: Age of Miguel de Cervantes Saavedra (Task number: 4031)

Determine the age of Miguel de Cervantes Saavedra


The task’s solution is very obvious, as both, his year of birth and death are marked on the entrance of the building. The difference results in the correct solution. Nevertheless, the task is a nice example for cultural references which can be forced through further information on the object.

The complete trail around the university of Alcala can be found here.

This week, we focus on a task that can be used to realize linear functions in the environment. It was created by Kim Biedebach in Kassel.

I became aware of MathCityMap during a didactics lecture as part of my teaching studies that I attended. The idea for the task actually came to me by chance. I am from Kassel and had in mind that I have to design a modelling task for the lecutre. When I passed the figure, I spontaneously decided that this might be a suitable task.


Task: Man walking to the Sky (Task Number 3832)

How many meters is the man on the pole above the ground?


For this, the pole on which the man steps up is interpreted as a linear function. The point at which the pole starts on the ground is chosen as point (0, 0) for the sake of simplicity. Now, the slope must be determined as the quotient of the change in vertical and the change in the horizontal. If one starts from the chosen origin, and walks e.g.one meter to the side and measures the height there, the slope can be determined.

Afterwards, the slope can be used to determine the equation of function. Then the distance from the origin to the human on the ground has to be determined (corresponds to the x-coordinate). This is best done by positioning oneself under the man and measuring the distance to the origin. By inserting into the function equation the height can be calculated.

The task makes the linear relationship of x and y coordinates particularly clear. Also the slope concept is discussed. Of course, alternative approaches can be chosen, such as using the intercept theorems.

This week, we would like to introduce you to a whole series of tasks in the Task of the Week section. Mathias Bärtl, Professor at the University of Offenburg, became aware of MathCityMap and adapted the system for students of his statistics lecture, for example in the task “Advertisement in the Subway”.


Task: Advertisement in the Subway

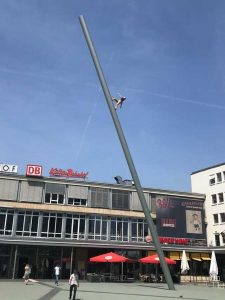
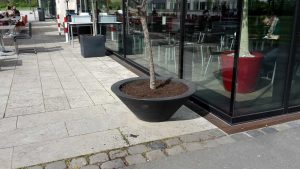
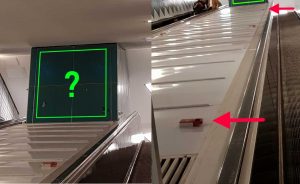
ONE STEP AHEAD Fitness would like to draw attention to visitors and place an advertising at the station “U2 Messehallen”, at the escalator to the “Karolinenstraße – Marktstraße – Hamburg Messe”.
Let’s say that an advertising must be on average for 25 seconds in the field of vision of a person before it is recognized, and that this range of vision here is between the first and penultimate emergency stop. Give the result as a whole percentage (say 25, if your computation is 0.252).


Using escalator speed and exponential distribution as a distribution function, the students can solve the task. In the interview, Mathias Bärtl himself gives an insight into the idea of ​​using MathCityMap for students.

In what context did you use MathCityMap? How did you hear about the project?

I got to know the MathCityMap project in March 2018 at the joint annual meeting of the GDMV in Paderborn. However, as so often not in a presentation, but in a casual conversation with the inventor of the app in the bus on our way to the conference. The combination of digital media, city exploration and work in a team on concrete objects inspired me immediately. I could imagine that even students feel appealed when being challenged with more demanding tasks. For me, this opens up a good opportunity to use contents of the statistics lecture in practical situations and a motivating environment.

What content and competences are used in your trail? Which target group is addressed?

The trail puts the participants – students of business related subjects – in the situation of a project manager, who should prepare the market introduction of fitness equipment. For this purpose, different places of Hamburg must be visited and analyzed under certain questions. My focus during the development was to pick up the contents of the statistics lecture and embed it in a coherent overall story, which at the same time requires the exploration of exciting places. Admittedly, I have not started primarily with the definition of desired competences. Ultimately, however, the tasks developed are to be assigned to mathematical modeling and solution. In terms of content, the areas of probability calculation, estimation and testing, but also correlation and regression are covered.

Have you already tested the trail and received feedback?

I did a test run with two students. It was about a test of the comprehensibility and feasibility of the individual tasks as well as an examination of the temporal approach. Of course, this cannot be considered as a test under scientific aspects. The two participants were extremely motivated and feedback like “It was really fun! I think that it will leave a positive impression on students.” promises that the idea will be well received on a larger scale, and I’m looking forward to offering it as an elective course with an excursion in the future.

We thank you for the interview and the great implementation of the MathCityMap idea in a new context.

During May, the MathCityMap Team created a trail in Zaryadye Parc in Moscow – in good time for the start of FIFA World Cup in June!

One of the included tasks is in the focus of the “Task of the Week”, not at the latest through the object’s impressive architecture.


Task: Distance (Aufgabennummer 3761)

Calculate the distance between the crosses at the top of the towers! Give the result in meters.


Already in the picture, it becomes obvious that the distance cannot be measured directly. Without the use of special measuring equipment, the task solvers have to develop a creative idea: The distance in the height can be projected on the ground.

This happens best through marked points at the building, or as shown in the picture from a certain distance. With this idea, the beginning problem of the height of the building can be avoided and the task can be solved easily.

In case you search in our MathCityMap portal, you might notice that flowerpots enable various geometric tasks. Solely through the high frequency and the different shapes (cylinder, prismn with hexagonal area, etc.), the question how many liters of soil fit into the flowerpot, can be realised. In today’s Task of the Week, the flowerpot has the shape of a truncated cone.


Task: Flowerpot (Task number: 1219)

How many liters soil fit into the flowerpot, when it is filled until the top?


The formula for the volume of a truncated cone might not be known by all students. Therefore, they need strategies in order to solve the task, e.g. by means of the difference of a big and a small come. Further challenges are the determination of the small radius with help of the circumference and the consideration of the edge/bottom, which is obviously not filled with soil.